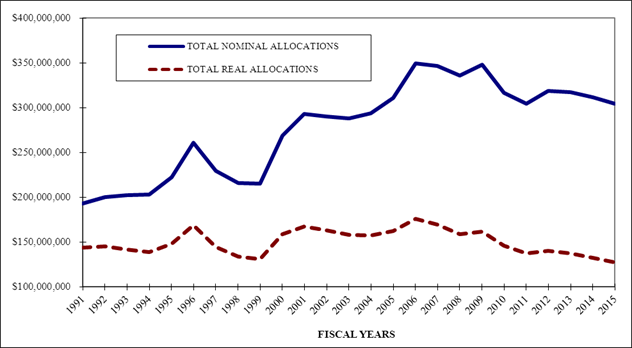
HIGHWAY FUND ALLOCATIONS: FY 1991 - FY 2015 |
|||||||||||
| ACTUAL VALUES | CPI | DEFLATED VALUES | |||||||||
| FISCAL | TOTAL NOMINAL | % | YEARLY | % | TOTAL REAL | % | |||||
| YEAR | ALLOCATIONS | CHG. | AVG. | CHG. | ALLOCATIONS | CHG. | |||||
| 1991 | $192,750,919 | -8.5% | 133.92 | 5.5% | $143,933,480 | -13.3% | |||||
| 1992 | $200,302,871 | 3.9% | 138.21 | 3.2% | $144,928,215 | 0.7% | |||||
| 1993 | $202,236,547 | 1.0% | 142.53 | 3.1% | $141,895,490 | -2.1% | |||||
| 1994 | $203,274,764 | 0.5% | 146.22 | 2.6% | $139,022,978 | -2.0% | |||||
| 1995 | $222,440,097 | 9.4% | 150.41 | 2.9% | $147,890,806 | 6.4% | |||||
| 1996 | $260,799,573 | 17.2% | 154.50 | 2.7% | $168,802,313 | 14.1% | |||||
| 1997 | $229,405,395 | -12.0% | 158.91 | 2.9% | $144,363,351 | -14.5% | |||||
| 1998 | $215,984,090 | -5.9% | 161.74 | 1.8% | $133,536,456 | -7.5% | |||||
| 1999 | $215,167,045 | -0.4% | 164.54 | 1.7% | $130,767,513 | -2.1% | |||||
| 2000 | $268,704,902 | 24.9% | 169.29 | 2.9% | $158,723,053 | 21.4% | |||||
| 2001 | $293,315,365 | 9.2% | 175.09 | 3.4% | $167,521,031 | 5.5% | |||||
| 2002 | $290,385,517 | -1.0% | 178.19 | 1.8% | $162,962,456 | -2.7% | |||||
| 2003 | $288,309,449 | -0.7% | 182.11 | 2.2% | $158,317,549 | -2.9% | |||||
| 2004 | $293,574,323 | 1.8% | 186.09 | 2.2% | $157,757,909 | -0.4% | |||||
| 2005 | $310,931,897 | 5.9% | 191.69 | 3.0% | $162,204,180 | 2.8% | |||||
| 2006 | $349,584,284 | 12.4% | 198.99 | 3.8% | $175,677,851 | 8.3% | |||||
| 2007 | $346,221,340 | -1.0% | 204.14 | 2.6% | $169,598,566 | -3.5% | |||||
| 2008 | $336,160,213 | -2.9% | 211.70 | 3.7% | $158,792,655 | -6.4% | |||||
| 2009 | $347,664,574 | 3.4% | 214.66 | 1.4% | $161,962,274 | 2.0% | |||||
| 2010 | $316,706,397 | -8.9% | 216.74 | 1.0% | $146,126,041 | -9.8% | |||||
| 2011 | $304,310,083 | -3.9% | 221.09 | 2.0% | $137,642,581 | -5.8% | |||||
| 2012 | $318,920,211 | 4.8% | 227.56 | 2.9% | $140,144,821 | 1.8% | |||||
| 2013 | $317,272,450 | -0.5% | 231.35 | 1.7% | $137,138,556 | -2.1% | |||||
| 2014 | * | $311,621,111 | -1.8% | 234.90 | 1.5% | $132,662,693 | -3.3% | ||||
| 2015 | * | $304,097,673 | -2.4% | 238.77 | 1.7% | $127,358,417 | -4.0% | ||||
| * | Amounts represent allocations through the 126th Legislature, 2nd Regular Session | ||||||||||
| CPI for FY 2014 and 2015 reflect projections of the Consensus Economic Forecasting Commission (February 2014) | |||||||||||
| SOURCES: | State of Maine Annual Financial Reports, OFPR Highway Fund Allocation Summaries | ||||||||||
| U.S. Dept. of Labor, Bureau of Labor Statistics, Consumer Price Index for All Urban Consumers | |||||||||||
| (Calendar Years 1982-84 Average = 100) | |||||||||||
|
|||||||||||